A Beginner’s Guide to Gantt Charts: Master Project Management with Celoxis

The Importance of Gantt Charts in Project Management
A project Gantt chart is a foundational tool in modern project management, offering a clear visual timeline of tasks, dependencies, and milestones. Gantt chart project management enables teams to plan, track, and deliver projects efficiently, ensuring everyone is aligned and informed.
Who This Guide Is For
New project managers seeking to master Gantt chart in project management.
Teams transitioning to digital project management tools.
Organizations aiming to improve project tracking and reporting.
Why This Guide Matters
Learning what is a Gantt chart and how to use one can dramatically improve project outcomes, reduce delays, and enhance team collaboration. Mastery of Gantt chart project management is essential for delivering successful projects.
What is a Gantt Chart?
A Gantt chart is a horizontal bar chart that visually represents a project’s schedule. Each bar corresponds to a task, showing its start and end dates, duration, dependencies, and progress. Gantt charts are essential for tracking project timelines, resource allocation, and milestones.
Key Components of a Gantt Chart
Task List: Breaks down the project into manageable units.
Timelines: Defines start and end dates for each task.
Milestones: Highlights major checkpoints or deliverables.
Dependencies: Shows relationships between tasks.
Resources: Allocates team members, tools, or budgets to specific tasks.
Progress Indicators: Visualizes the percentage of completion for each task.
How Does a Gantt Chart Work?
A project Gantt chart works by mapping out all project activities along a timeline. Tasks are sequenced, dependencies are defined, and resources are allocated. As work progresses, updates are made to reflect real-time status, making it easy to spot delays, bottlenecks, or resource conflicts.
Benefits of Using Gantt Charts in Project Management
Visual Clarity: Instantly see project status and upcoming deadlines.
Improved Planning: Break down complex projects into actionable steps.
Enhanced Communication: Share progress with stakeholders and team members.
Resource Optimization: Allocate and balance workloads efficiently.
Risk Mitigation: Identify potential delays early and adjust plans proactively.
Why Every Project Manager Should Master Gantt Charts
Mastering Gantt chart project management empowers managers to deliver projects on time, coordinate teams and resources, respond quickly to changes, and provide transparent updates to clients and executives.
High-Level Benefits of Using Gantt Charts
Centralized Project Information
Real-Time Progress Tracking
Improved Stakeholder Communication
Efficient Resource Allocation
Proactive Risk Management.
Common Project Management Challenges Solved by Gantt Charts
Lack of Visibility: Gantt charts provide a clear overview of all tasks and deadlines.
Poor Communication: Centralizes project information for all stakeholders.
Missed Deadlines: Highlights critical paths and dependencies to avoid delays.
Resource Conflicts: Tracks resource allocation and prevents overloading.
Key Components of a Gantt Chart
Component | Description |
|---|---|
Task List | Breaks project into manageable units |
Timelines | Sets start and end dates for each task |
Milestones | Marks major project checkpoints |
Dependencies | Shows relationships between tasks |
Resources | Assigns people, tools, or budgets to tasks |
Progress | Tracks completion status of each task |
How to Create a Gantt Chart: Step-by-Step Guide
Define Project Goals: Break them into smaller, manageable tasks.
Organize Tasks: Group tasks into logical phases or categories.
Set Realistic Dates: Assign start and end dates for each task.
Identify Dependencies: Link tasks that rely on one another.
Assign Resources: Allocate team members, tools, or budgets.
Track Progress: Update the chart regularly to reflect changes.
Tools for Creating Gantt Charts
Overview of Popular Tools
Celoxis: Advanced Gantt charts, resource management, real-time dashboards.
Microsoft Project: Comprehensive project planning and scheduling.
Asana: Visual project timelines and task management.
Trello: Simple timeline views with add-ons.
Smartsheet: Spreadsheet-style Gantt chart project management.
Free vs. Paid Tools
Free Tools: Basic Gantt chart functionality, limited features.
Paid Tools: Advanced scheduling, resource management, integrations, analytics.
How to Choose the Right Tool
Assess project complexity and team size.
Consider integration needs and reporting requirements.
Evaluate ease of use and scalability for future projects.
Sample Gantt Chart in Celoxis
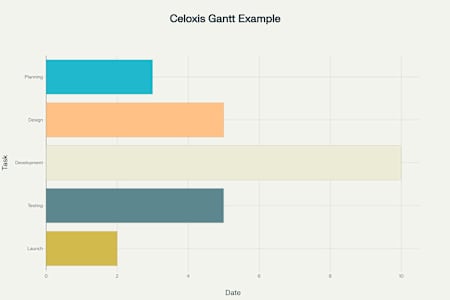
Sample Gantt Chart for a Project in Celoxis
Below is a sample Gantt chart as visualized in Celoxis, illustrating tasks, timelines, dependencies, and progress for a typical project.
Best Practices for Using Gantt Charts Effectively
Keep It Simple: Avoid overloading the chart with too many tasks.
Update Regularly: Reflect real-time changes to keep the chart relevant.
Use Colour Coding: Enhance visualization of progress and status.
Share with Stakeholders: Ensure alignment and transparency across teams.
Common Mistakes to Avoid When Using Gantt Charts
Overcomplicating the Chart: Too many details can reduce clarity.
Neglecting Updates: Outdated charts lose their value.
Setting Unrealistic Deadlines: Leads to missed targets and stress.
Ignoring Team Input: Collaboration ensures more accurate planning.
FAQs About Gantt Charts
Can Gantt charts be used for small projects?
Yes, Gantt charts are effective for projects of any size.
What’s the difference between Gantt charts and Kanban boards?
Gantt charts focus on timelines and dependencies, while Kanban boards visualize workflow stages.
How often should you update a Gantt chart?
Update regularly—ideally weekly or after any significant project change.
Do you need expensive software to use Gantt charts?
No, many tools (including Celoxis) offer affordable or free plans for basic needs.
How do Gantt charts help with resource management?
They visualize resource allocation and prevent overloading.
Can Gantt charts be used in agile project management?
Yes, Gantt charts can complement agile practices by providing high-level timelines.
Can Gantt charts show critical path analysis?
Absolutely, most advanced tools (like Celoxis) highlight the critical path.
Can I create a Gantt chart for a multi-phase project?
Yes, Gantt charts are ideal for visualizing complex, multi-phase projects.
How do I deal with changes in project scope using a Gantt chart?
Update tasks, timelines, and dependencies to reflect new requirements.
What are the key components of a Gantt chart in project management?
Task list, timelines, milestones, dependencies, resources, and progress indicators.
How do Gantt charts improve communication within project teams?
By providing a single source of truth for schedules and responsibilities.
What industries benefit most from using Gantt charts?
Construction, IT, marketing, manufacturing, healthcare, and more.


Comments
Post a Comment